Global IMPACT: How We Partnered with the United Nations to Improve the Social Good

When you’re researching MBA programs, you might notice how many of them say that you’ll “get the chance to have a global impact” with their program. Many of us gloss over those statements thinking, “that’s nice, but there’s no way that will actually happen.” I know that’s what I thought.
Well, I’m here to tell you that, at UC Davis, you actually CAN make a global impact with your work. How do I know? I’m here to tell you.
A Project for the United Nations
In the Fall 2021 quarter, I was lucky to join a team of fellow MBA students to work on a project aiming for positive social change for the United Nations. The consulting work was part our Integrated Management Project, Articulation and Critical Thinking (IMPACT) project, which is a signature capstone course for second-year MBA students in Graduate School of Management.
The goal of our project was to increase the awareness and inspire the adoption of Knowledge Graphs (KGs) by the social-good community.
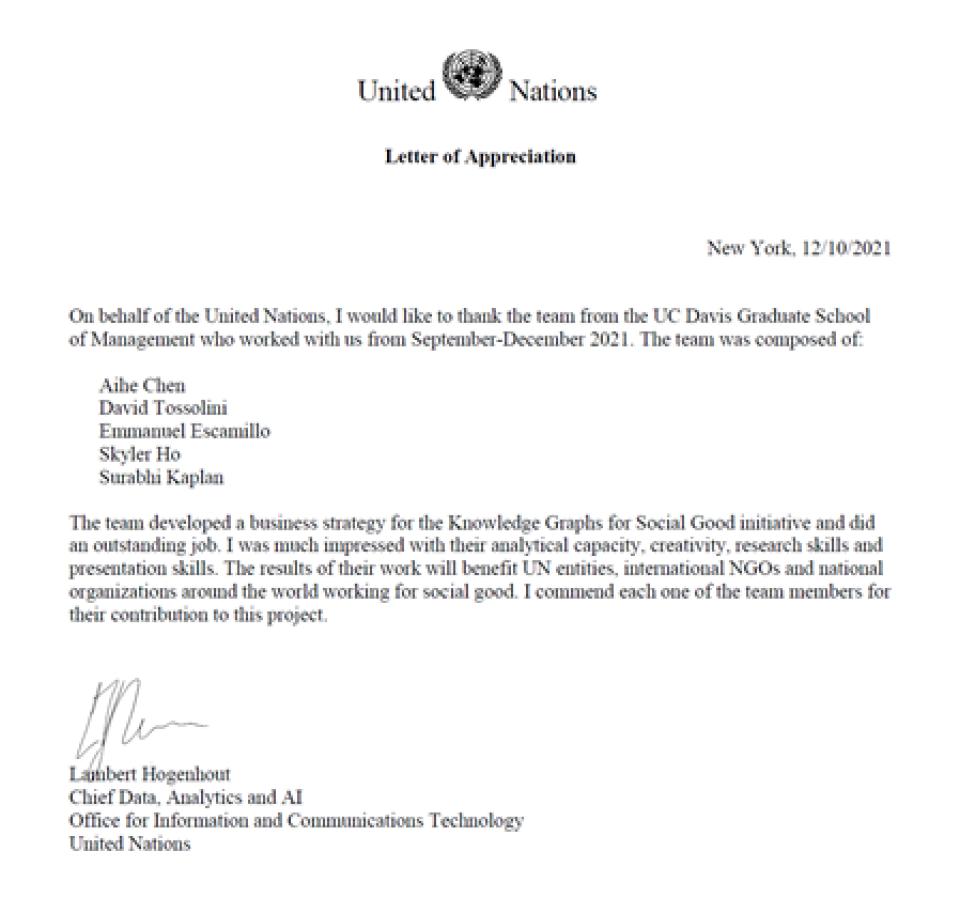
After our 10-week effort, we presented to the client, which said our team “did an outstanding job.” We were awarded an official certificate of appreciation issued from the United Nations Office of Information and Communications Technology.
“I was much impressed with their analytical capacity, creativity, research skills, and presentation skills,” our contact at the U.N., Lambert Hogenhout, wrote in a letter. “The results of their work will benefit U.N. entities, international Non-government organizations (NGO) and national organizations around the world working for social good. I commend each one of the team member for their contribution to this project.”
Ambiguity and a Learning Curve
While that made us feel like rock stars, our road to this success was far from glamorous. Rather than consulting for a profit-driven company, our project dealt with a new concept, Knowledge Graph for Social Good, to be initiated by a non-profit organization.
Knowledge graph is a knowledge base that uses a graph-structured data model or topology to integrate data. Unlike a tangible and visible product, a knowledge graph is more abstract, vague and complicated than many other IMPACT project solutions. Though the term is not new, the application of it is still very limited in the industry and not widely known by the public.
On top of this, no one on our team had a technical background, so initially we were even struggling to find out what knowledge graph was. It was going to be pretty hard to sell it to others if we didn’t know what it was. That being said, we had to do quite a lot of research before we could nail down the strategic request from the client.
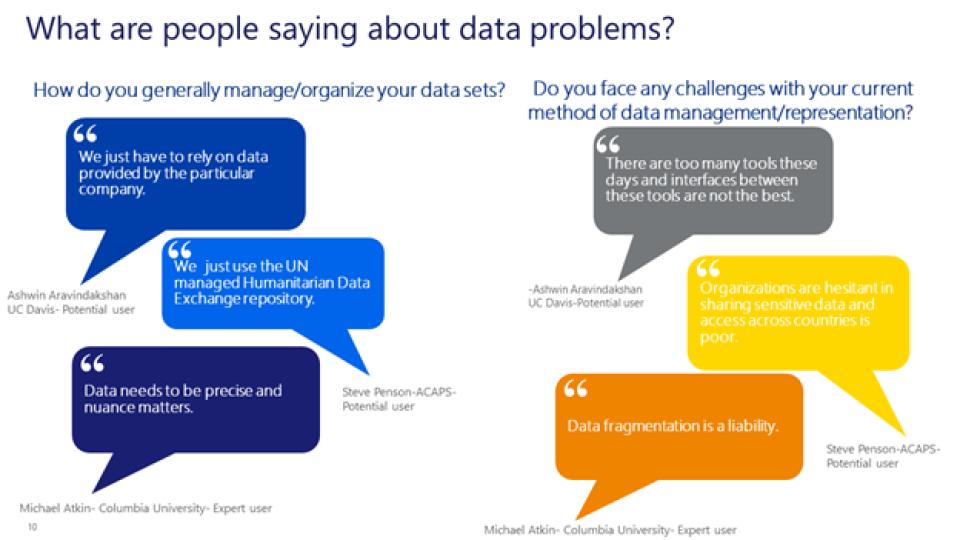
Thanks to the team’s proactive approach and the useful resources from the client, we were able to several great user cases. These proven, practical and successful cases, which included multi-media displays, made the obscure concepts much easier to digest.
What is a Knowledge Graph?
Fact-based marketing research was critical for us and helped us understand how organizations that deal with data would potentially frame the knowledge graph ecosystem.
The very limited reachable contacts in the wide International NGO pool, however, also posed an obstacle to our progress. That forced us to utilize every piece of networking resources and unmined technics to obtain the information we wanted.
Cold Calling with Confidence
With contacts in hand, we proactively approached potential users as well as existing users. We successfully conducted 13 cold-call interviews with positive responses from participants ranging from International NGO directors and data repository managers, to management consultants and professors. We were overwhelmed by their generosity and willingness to dedicated time out of their busy schedules to talk with us. They had no obligation to help us, nor did we provide them with any incentives for their participation.
The interviews provided us with invaluable, primary insights about knowledge graphs and data management practices. We would never have known any of this if we were not brave enough to make cold calls, and they were nice enough to answer.
The client was extremely impressed with our findings from the potential users. The pain points, along with the desires of data practitioners, shined a light on what features we should shout out on knowledge graphs in the next phase.
The experience taught us that things will work out if you don’t scare away and instead challenge yourself to go outside of your comfort zone.
Turnaround in the Middle Way
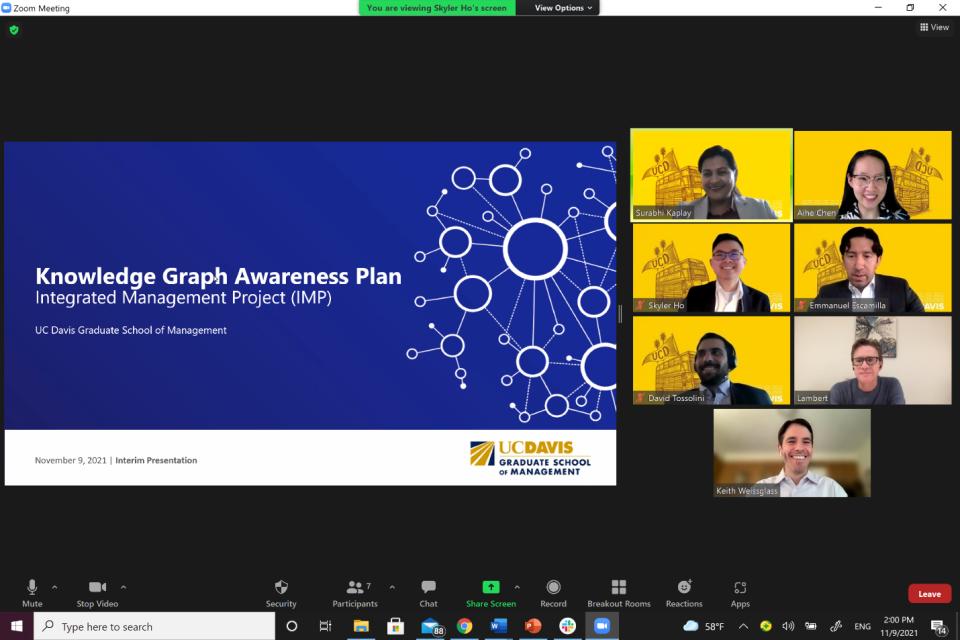
Half way through the project, we had to present our initial findings to the client. We were confident going through our presentation, thinking we were right on the track to announce the second half deliverables, when the client said they had a different idea.
They pointed out that instead of a pitch deck and a marketing plan like we proposed, they would like a resourcing plan and a strategic partnership plan. The goal was to position the U.N. as a technology broker in the partnership, rather than just provide the knowledge graph technology service itself directly to the vendors.
The U.N. wanted to be a bridge to connect the vendors to target users within international NGO community to catalyze the adoption of knowledge graphs.
They also wanted these partners to act as a mediator to negotiate financial-friendly packages to support small organizations that committed to the social goods purpose.
We realized then there was a bit of a disconnect between what we thought was needed and what the client wanted. It was a great lesson learned through experience. In a real consulting project, the client’s objectives are always the priority. To that end, clear and constant communication to understand their problem is critical, especially when the reality surrounding the project is changing. We learned to be more adaptive and resilient to the solutions based upon the evolving situations.
As hard as it was to realize this disconnect, we were glad we discovered it when we did in the middle of the project and not at the end. It gave us time to adjust our plan, fine tune it and ultimately be successful.
Great Leadership and Collaboration
As an efficient team, we brainstormed, shared views, divided assignments and got the job done without much back-and-forth or inefficiencies. We accomplished everything as scheduled and, as a result, team morale stayed high from beginning to end. The leadership and collaboration we experienced during the project indeed set a good model to the future leaders among us.
Trip to U.N. Headquarters in NYC?
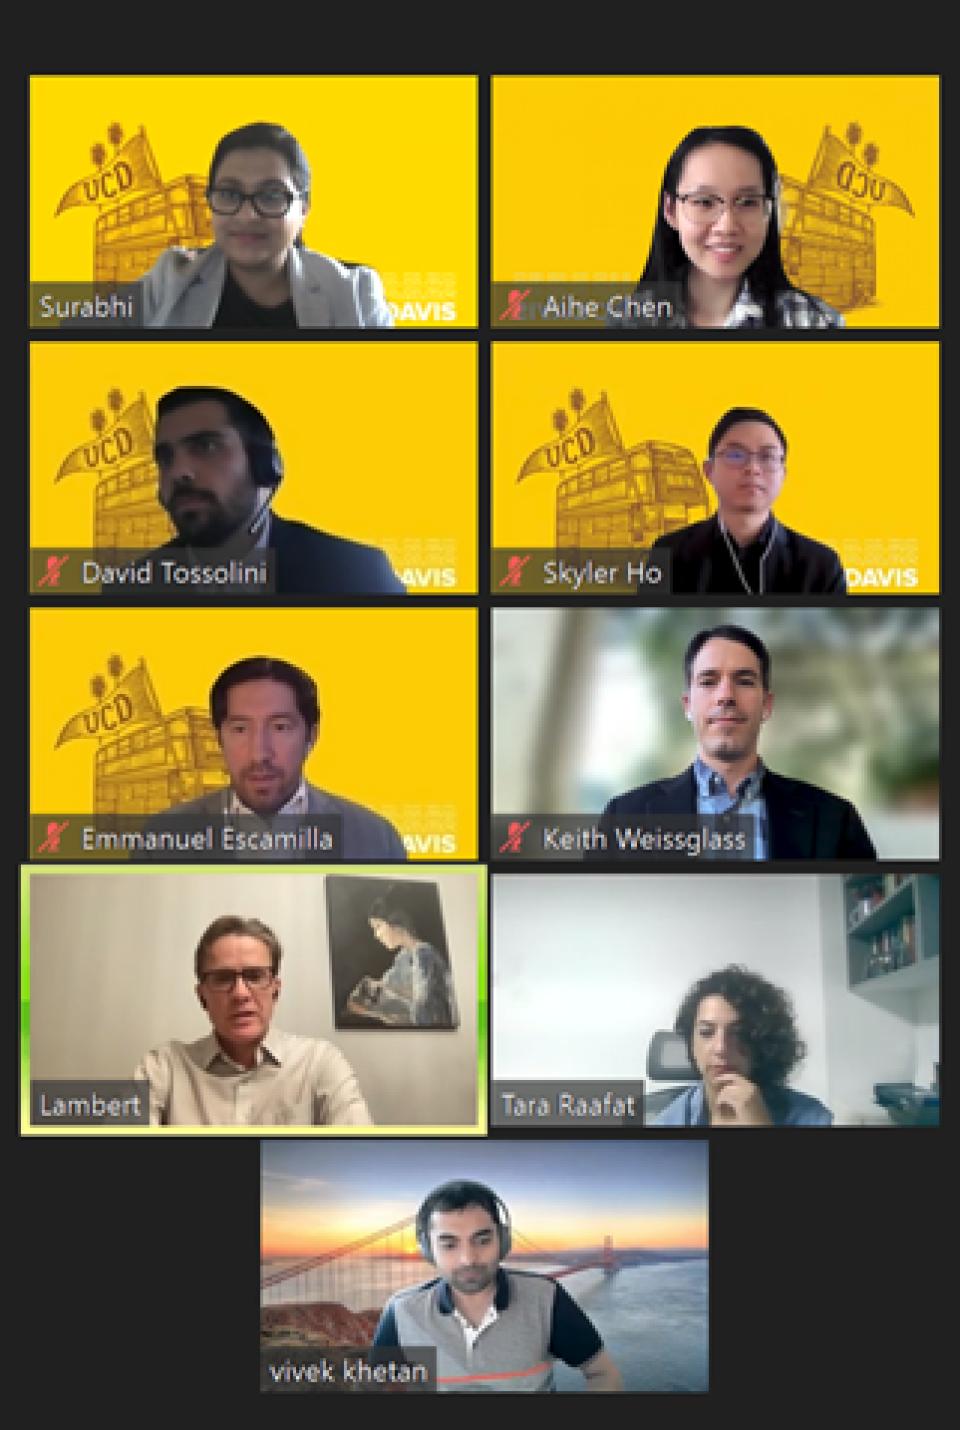
In the final presentation to the U.N. panels, we received remarkable praises from the client.
For example, Lambert commented: “Amazing job! You guys understand exactly what our ask was. I've seen presentations from many famous consulting companies like Accenture and Deloitte, and I can tell you that you definitely give them a run for their money.”
He also told us that they’ve already planned a board meeting in the near future to discuss the following actions based on our doable, short-term, medium-term and long-term roadmap.
As a way to show the U.N.’s great appreciation for our work, Lambert even offered us a tour of U.N. Headquarters in New York City when the pandemic is over. How exciting is that? It would be amazing to see our proposal be really implemented in U.N. office!
The whole experience was amazing! Not only was the idea we presented unanimously endorsed, but it also is bound to make real impact on social good community.